 Known as the father of value investment, Benjamin Graham was an economist and a professional investor. Warren Buffett states that Graham is the second most influential person in his life after his father. Benjamin Graham is famous for his simple yet powerful estimation rules. In his famous book, Renaissance of Value, Benjamin Graham suggests a rule-of-thumb for estimating the intrinsic value of a company:
Value = EPS x (8.5 + 2 x Estimated Earnings Growth) x (4.4 / AAA Corporate Bond Yield)
Note that this is a long-term valuation. It does not imply any target price estimate. Moreover, according to this valuation, companies that are currently loss-making are worth zero. However, the formula can still be used to calculate the margin of safety in the long run:
Margin of Safety = (Intrinsic Value – Price) / Valuation
Graham suggested choosing the undervalued stocks with the highest margin of safety. Warren Buffett explains the margin of safety as paying $70 for a stock with intrinsic value of $100. Graham is a value investor, and he also suggested choosing dividend stocks with positive earnings, strong balance sheets and reasonable P/E ratios.
Therefore, I screened for top industrial producers that pay at least some dividends, reported positive earnings, have a P/E ratio lower than 20. All companies are U.S.-based industrials with at least some positive growth in the past, and reasonable (<20%) annual growth estimates. Stock market data is retrieved from Finviz, Google Finance, Yahoo Financeand/or Zacks Investment Research. Corporate bond data is retrieved from Federal Reserve Bank of St. Louis. If you are interested in the energy stocks with highest margin of safety, click here.
Company | P/E | EPS | Earnings Growth | Intrinsic Value | Safety Margin |
Quanex Products (NX) | 6.39 | 2.99 | 10.00% | 71.63 | 73.31% |
Alliant Tech. (ATX) | 7.74 | 8.97 | 6.27% | 158.47 | 56.21% |
AZZ Inc. (AZZ) | 16.64 | 2.68 | 17.33% | 97.17 | 54.10% |
Dover Corp. (DOV) | 16.89 | 3.75 | 16.87% | 133.06 | 52.40% |
Koppers (KOP) | 17.31 | 2.15 | 17.33% | 77.95 | 52.25% |
Raytheon (RTN) | 10.36 | 4.80 | 8.62% | 103.79 | 52.08% |
Standex Int. (SXO) | 13.24 | 2.65 | 12.00% | 72.35 | 51.50% |
General Dynamics (GD) | 10.89 | 6.83 | 8.83% | 150.09 | 50.44% |
Lockheed Martin (LMT) | 11.18 | 7.20 | 9.17% | 162.40 | 50.41% |
John Bean (JBT) | 13.82 | 1.30 | 12.00% | 35.48 | 49.38% |
L-3 Comm. (LLL) | 9.5 | 8.27 | 6.90% | 154.86 | 49.28% |
Matthews Int. (MATW) | 15.53 | 2.33 | 13.50% | 69.49 | 47.92% |
Ameron Int. AMN) | 14.29 | 5.11 | 12.00% | 139.54 | 47.66% |
SPX Corp. (SPW) | 19.63 | 3.85 | 17.87% | 143.10 | 47.18% |
Timken (TKR) | 17.6 | 2.73 | 15.53% | 90.74 | 47.04% |
Littelfuse (LFUS) | 15 | 3.52 | 12.00% | 96.08 | 45.05% |
Pentair (PNR) | 18.15 | 1.99 | 14.53% | 62.79 | 42.47% |
Cummins (CMI) | 18.92 | 5.28 | 15.23% | 172.83 | 42.19% |
Illinois Tool W. (ITW) | 17.82 | 3.03 | 13.74% | 91.59 | 41.04% |
3M (MMM) | 15.8 | 5.63 | 11.48% | 148.82 | 40.21% |
Alamo Group (ALG) | 15.34 | 1.78 | 11.00% | 45.59 | 40.12% |
Eaton Corp, (ETN) | 19.03 | 2.72 | 14.62% | 86.21 | 39.97% |
Regal Beloit (RBC) | 18.55 | 3.84 | 13.67% | 115.62 | 38.38% |
Nordson (NDSN) | 19.32 | 5.46 | 14.25% | 169.73 | 37.84% |
Snap-on (SNA) | 18.08 | 3.19 | 13.00% | 92.42 | 37.61% |
Joy Global (JOYC) | 19.86 | 4.63 | 14.20% | 143.52 | 35.93% |
Boeing (BA) | 15.53 | 4.45 | 10.11% | 107.34 | 35.63% |
Parker Hannifin (PH) | 17.09 | 5.19 | 11.30% | 135.60 | 34.58% |
ITT Corporation (ITT) | 16.05 | 3.53 | 10.33% | 86.46 | 34.47% |
Triumph Group (TGI) | 15.36 | 5.54 | 9.70% | 129.83 | 34.46% |
RPM Int. (RPM) | 17.19 | 1.30 | 11.33% | 34.03 | 34.33% |
Flowserve (FLS) | 17.78 | 6.88 | 11.50% | 182.02 | 32.80% |
Rockwell Collins (COL) | 16.88 | 3.72 | 9.64% | 86.79 | 27.66% |
Valspar (VAL) | 17.12 | 2.20 | 9.50% | 50.83 | 25.89% |
Goodrich (GR) | 18.56 | 4.50 | 10.44% | 111.08 | 24.79% |
Deere & Company (DE) | 18.09 | 4.98 | 9.94% | 118.73 | 24.12% |
Crane (CR) | 17.96 | 2.59 | 8.70% | 56.35 | 17.45% |
Curtiss-Wright (CW) | 14.57 | 2.30 | 3.00% | 28.01 | -19.62% |
Average | 15.76 | 11.77% | 40.22% |
The average P/E ratio of the companies in the list is 15.76, with an expected earnings growth around 11.77%. While average 11.76% earnings growth might seem over optimistic, it reflects the past performance and strong growth potential in the industrial sector.
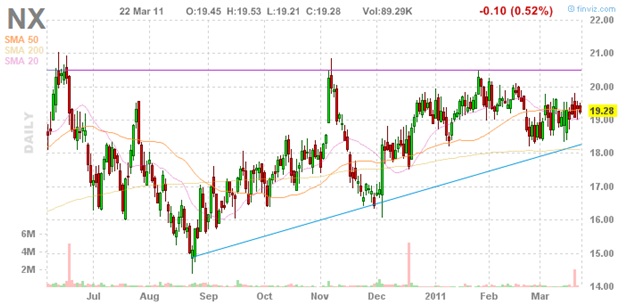
Unlike the future discounted earnings model, Benjamin Graham formula accounts for both value and growth stocks. According to Finviz data, top two companies-- Quanex and Alliant-- have single digit trailing year P/E ratios of 6.39 and 7.74, followed by two companies that have double digit P/E ratios-- AZZ Incorporation and Dover Corporation have P/E ratios of 16.64 and 16.89, respectively.
I am not a big fan of technical analysis, and I try to avoid using it in my investment decisions. Nevertheless, it might be complementary to consider graphical analysis, only after performing due diligence and relevant fundamental analysis. While looking at Quanex's graph, I noticed such a nice-shaped triangle with almost perfectly drawn support and resistance levels. Quanex already passed the Benjamin Graham benchmark. Therefore, one might want to watch out for the breaking directions:
Click to enlarge

Disclosure: I have no positions in any stocks mentioned, and no plans to initiate any positions within the next 72 hours.
No comments:
Post a Comment