
During the first major week of earnings we saw the market rally as companies beat or matched expectations. On the one hand, I am currently pessimistic about the market, while on the other hand I was not surprised by the rally. I was not surprised because, as my last article, These 7 Tech Stock Earnings Will Lead the Market points out; certain trends and points of interest in a companies’ chart can lead an investor to rallies and dips before they happen. I focused on several points of the charts that would have given investors a heads up to the successful earnings reports given so far in the technology sector. This time I will use simple trending and moving averages (SMA) to show how investors can spot long term growth companies before the next big rally. I will use Caterpillar (CAT), Agco (AGCO), and Deere and Co. (DE) to show how these trends work.
One important factor to note about Deere and Agco, and to a lesser extent Caterpillar, is that commodity prices play an important role as to how much equipment farmers and construction companies purchase. Since commodity prices have been high for the past few months we should see strong earnings from these companies. With that said, nothing is guaranteed when it comes to the stock market.
One important factor to note about Deere and Agco, and to a lesser extent Caterpillar, is that commodity prices play an important role as to how much equipment farmers and construction companies purchase. Since commodity prices have been high for the past few months we should see strong earnings from these companies. With that said, nothing is guaranteed when it comes to the stock market.

Caterpillar
Caterpillar is one of the largest, if not the largest, manufacturers of construction and mining equipment. Simply put, Caterpillar products are used at many new building projects around the world. This has been one reason Caterpillar has been able to continuously grow year over year. This trend can be seen by viewing the last 10 years of the chart below.
Caterpillar is one of the largest, if not the largest, manufacturers of construction and mining equipment. Simply put, Caterpillar products are used at many new building projects around the world. This has been one reason Caterpillar has been able to continuously grow year over year. This trend can be seen by viewing the last 10 years of the chart below.
Click to enlarge:

As you can see the company has continuously grown, particularly over the past 10 years, despite a major hiccup when the market crashed in 2008. During that crash Caterpillar was able to stabilize and rebound to an almost 20% higher level than they were pre-2008 crash. When you shorten the chart to a mere 12 months, it is easy to analyze the 50 and 200 SMA. The 200 SMA shows that Caterpillar has been on a continuous uptrend; which is reinforced by the 10 year chart that shows a continuous positive trend line.

As you can see the company has continuously grown, particularly over the past 10 years, despite a major hiccup when the market crashed in 2008. During that crash Caterpillar was able to stabilize and rebound to an almost 20% higher level than they were pre-2008 crash. When you shorten the chart to a mere 12 months, it is easy to analyze the 50 and 200 SMA. The 200 SMA shows that Caterpillar has been on a continuous uptrend; which is reinforced by the 10 year chart that shows a continuous positive trend line.
In order for Caterpillar to follow this trend it will need a strong earnings report. I am expecting an EPS of $1.52, which is above the January report of $1.47. This further reinforces that using 200 SMA and long term trends are good indicators of how a company will grow.
Click to enlarge:

A more specific way to analyze a companies’ chart is the 50 SMA. The 50 SMA for Caterpillar has been positive for about 46 of the past 52 weeks. Therefore, the share price has been progressing over the past year on a consistent basis. Since these companies follow their trends, we should be seeing Caterpillar continue to move in the upward direction. It is noteworthy to remind yourself that this progression has been fronted by positive earnings releases every quarter. Therefore with an earnings report preceded by high commodity prices, which is what we have right now, we should see an earnings beat. Another point to focus on is the recent crossover between the share price and the 50 SMA. This usually signifies a change in momentum, either up or down. Since the 50 SMA is trending up I am placing a floor on Caterpillar shares at the $102-$103 range. This floor, along with the 50 SMA shows investors that Caterpillar is heading for its 52 week high sometime in the next couple months.
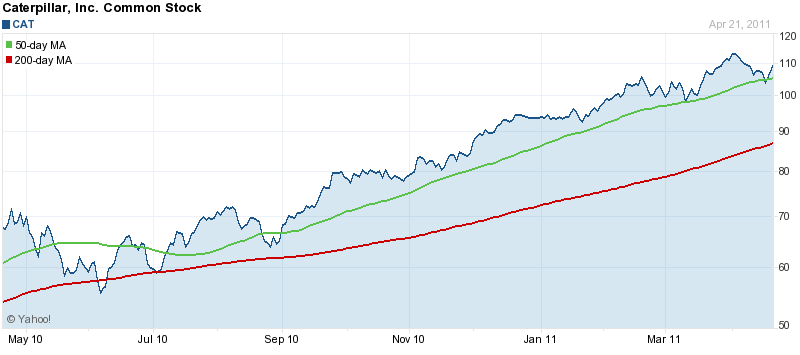
A more specific way to analyze a companies’ chart is the 50 SMA. The 50 SMA for Caterpillar has been positive for about 46 of the past 52 weeks. Therefore, the share price has been progressing over the past year on a consistent basis. Since these companies follow their trends, we should be seeing Caterpillar continue to move in the upward direction. It is noteworthy to remind yourself that this progression has been fronted by positive earnings releases every quarter. Therefore with an earnings report preceded by high commodity prices, which is what we have right now, we should see an earnings beat. Another point to focus on is the recent crossover between the share price and the 50 SMA. This usually signifies a change in momentum, either up or down. Since the 50 SMA is trending up I am placing a floor on Caterpillar shares at the $102-$103 range. This floor, along with the 50 SMA shows investors that Caterpillar is heading for its 52 week high sometime in the next couple months.

Agco Corporation
Agco manufactures and distributes farming equipment. Therefore it has an advantage over some companies that solely manufacture or distribute goods since it does not have to pay extra fees. Agco is set to report April 26th and in my mind the bar is very high due to this past week's rally. We are expecting Agco to produce an EPS of 47 cents, which is up from 10 cents this quarter last year.

 Click to enlarge:
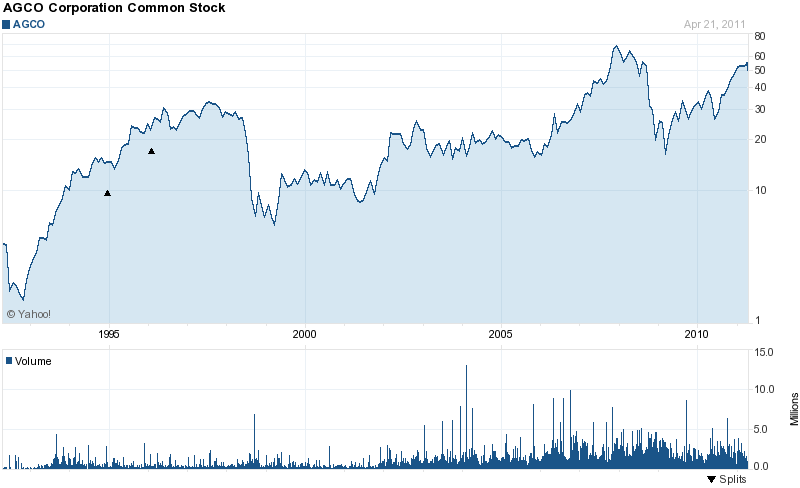
By studying Agco's 10 year chart we see an uptrend that is more flattened when compared to Caterpillar. This shows less growth from the company. Which is clearly seen by studying the 200 SMA and the expectations for this quarter's earnings report. For instance, Agco is the only company listed here that has a 200 SMA that goes negative during the past year. Also, the April 26th EPS is expected to decline from the previous quarter. Granted it is not impossible for Agco to give an actual EPS of 89 cents but it is highly unlikely. However as you can see hereMartin Richenhagen, Agco's CEO, states that
markets are stronger than expected... Europe is doing much better than expected [while] the U.S. is a little bit better and South America is like we thought.
This positive outlook reinforces the upward trend that we see in the chart.
Click to enlarge:

Just as with Caterpillar, Agco recently crossed over the 50 SMA. Which means, assuming we do not see a negative earnings or down outlook, I am setting a floor in the $51 range for Agco. However I am cautious towards Agco since the 50 SMA is currently flat which means it could easily go up or down depending on the next month or so. And since you always want to stay clear of companies with negative moving averages then I warn investors about taking any new positions on Agco. With that said, Agco's chart is trending upwards over the past year. This leads me to believe that the share price will not fall below the floor I have set. Agco presents results three days before Caterpillar, which means if Agco hits expectations Caterpillar should get a boost from that. But if Agco misses estimates, Caterpillar may not be affected since it has a more diversified portfolio of products that increase revenue.
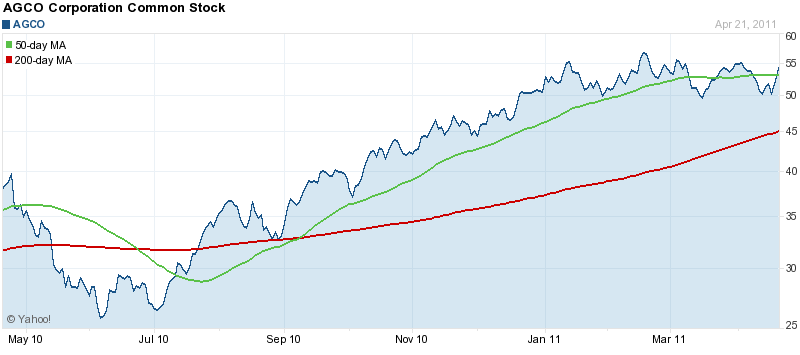
Just as with Caterpillar, Agco recently crossed over the 50 SMA. Which means, assuming we do not see a negative earnings or down outlook, I am setting a floor in the $51 range for Agco. However I am cautious towards Agco since the 50 SMA is currently flat which means it could easily go up or down depending on the next month or so. And since you always want to stay clear of companies with negative moving averages then I warn investors about taking any new positions on Agco. With that said, Agco's chart is trending upwards over the past year. This leads me to believe that the share price will not fall below the floor I have set. Agco presents results three days before Caterpillar, which means if Agco hits expectations Caterpillar should get a boost from that. But if Agco misses estimates, Caterpillar may not be affected since it has a more diversified portfolio of products that increase revenue.

Deer and Company
Simply put, Deere is a combination of Caterpillar and Agco. Since Deere is in the business of agricultural equipment as well as construction equipment. Deere reports May 18. This means we should have a pretty clear understanding of whether or not Deere will miss or beat expectations. Deere is expected to give an EPS of $2.32 which is well above last quarter and March 2010. Deere's chart shows that the EPS growth spurt has been predictable for almost a year. We are able to predict this growth because the 50 SMA recently crossed over the share price.
Click to enlarge:

Deere's chart is almost identical to Caterpillar, which means the technicals are very similar. Also, Deere should get a boost if Caterpillar's outlook and conference call is strong. Another reason Deere's EPS increase is predictable is because the 200 SMA is more linear, compared to Caterpillar, and almost a perfectly straight line at an upward angle. This shows Deere has had continuously even growth over the past year. Combine this with the upward trend of the 50 SMA and the recent 50 SMA crossover and I am setting a floor in the $91 range. Granted, if commodity prices plummet or Deere has a rare earnings miss, then I will have to change that value.
When comparing Deere to Caterpillar we see that both companies have followed each other throughout the past year. The most important point to look at when comparing these two charts is the past few weeks. As you can see, Deere's 50 SMA has began to flatline, while Caterpillar's has not. However, Deere does have a more linear 200 SMA. If you are interested in investing in either company, my opinion is to look into the past years quarterly reports and check exact growth percentages.
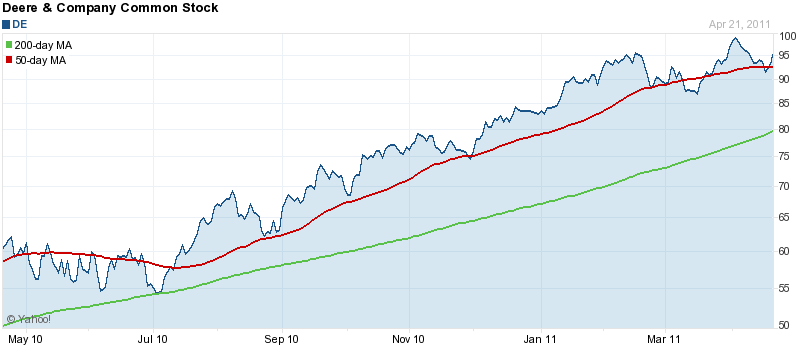
Studying a chart that compares both companies over the past year shows that both are about even, and it is almost impossible to make a prediction as to which company will outperform the other over the next year. Therefore I must say both have long term advantages but I would not recommend holding both in the same portfolio. Even though both will continuously grow, I do not recommend holding two companies that are nearly the same since your money would be better some place else.
Click to enlarge:


The main point to take from this is that trends are continuous and easy to spot if you take the time to study charts of companies. Based upon the charts, Deere is the most consistent long term growth stock of the three. With that said, Caterpillar has recently surpassed Deere on the head to head chart. Also it is worthy to note that these companies follow the general stock market closely, despite relying on farmers' orders whom rely on commodity prices.
No comments:
Post a Comment